Report editor introduction
With the report editor you can write narrative reports with graphs.
Some of the features of the report editor are :
- Write text in your own style using the built in editor
- Define and use graphs in your report
- Perform complex calculations before showing the report, like calculating derived scores, renorming using your own norms, et cetera
- Generate text in code if required, for example a HTML table resulting from a calculation
You can write reports on your own tests, but also on tests that are stored centrally in the ITR system and which you normally cannot edit.
To access the report editor you will need to have the right as Report author.
- Open the ITR menu, access Test and Reports and select the menu item "Edit report definitions".
- The list of tests will appear. Select the test you want to write or edit a report for.
- Select the report you want to edit or add a new one
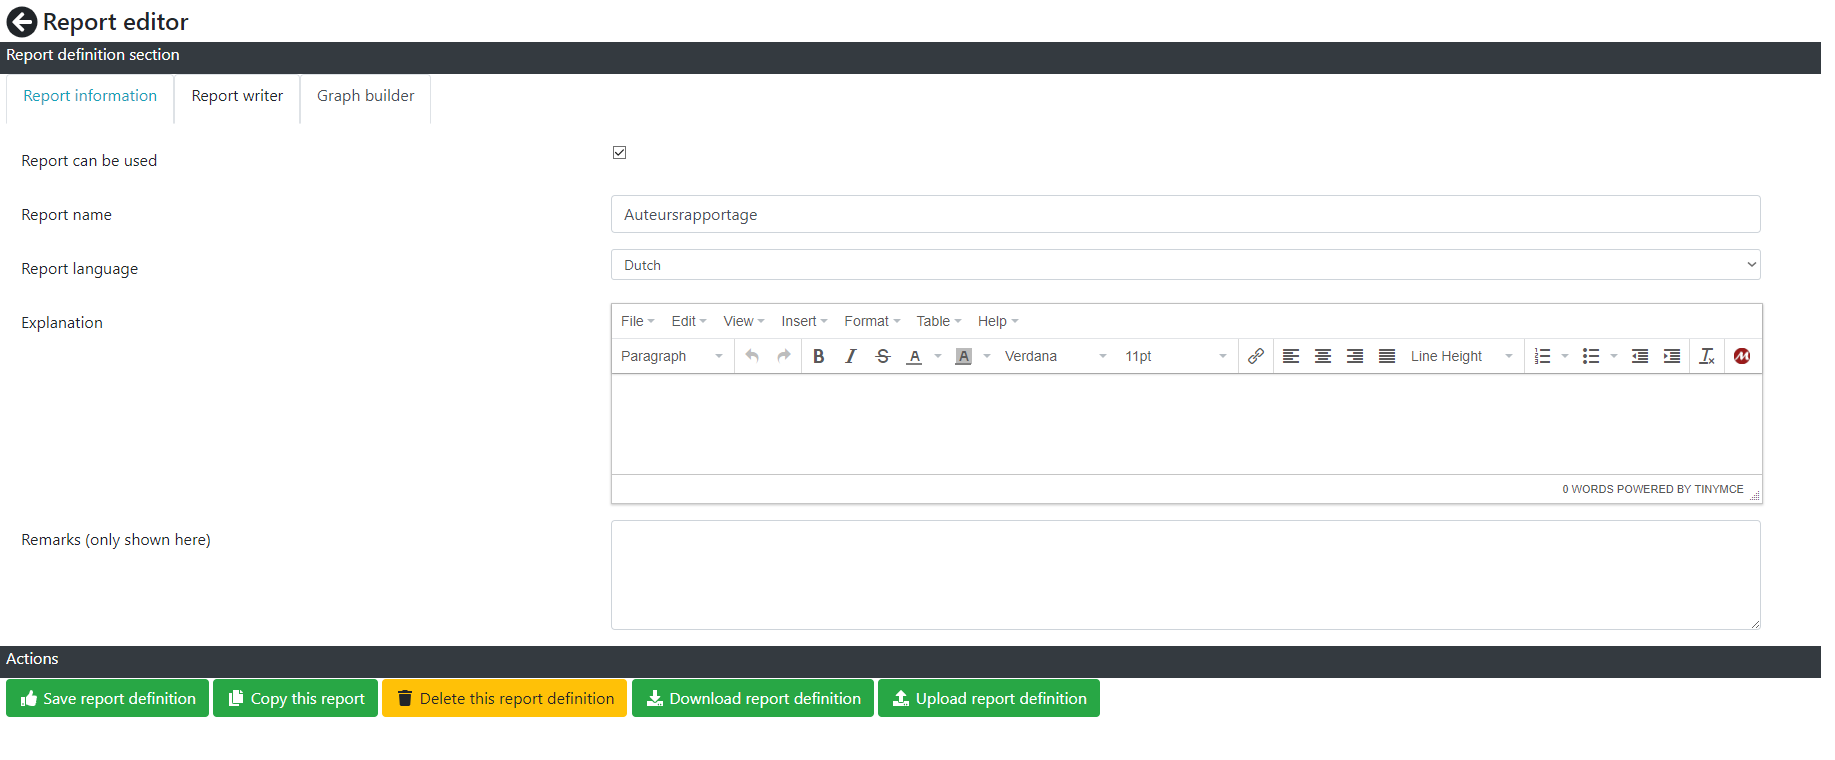
You will and up in the "Report editor" screen. The screen looks like this.
The screen has a tabbed layout. If you click on the headers "Report information", "Report writer" or "Graph builder" the screen will change.
"Report information" tab
On the "Report information" tab the following information can be entered.
- Report can be used; check this if you are ready with the report and the consultants in your organisation are able to use the report from the point on. If you disable the check the report will no longer appear in the available reports list.
- Report name; the name of the report
- Report language; the language of the report
- Explanation; a text that explains what the report does. At this moment this text is not used but in the future it will be shown to consultants.
- Remarks; any remarks you might have
"Report writer" tab
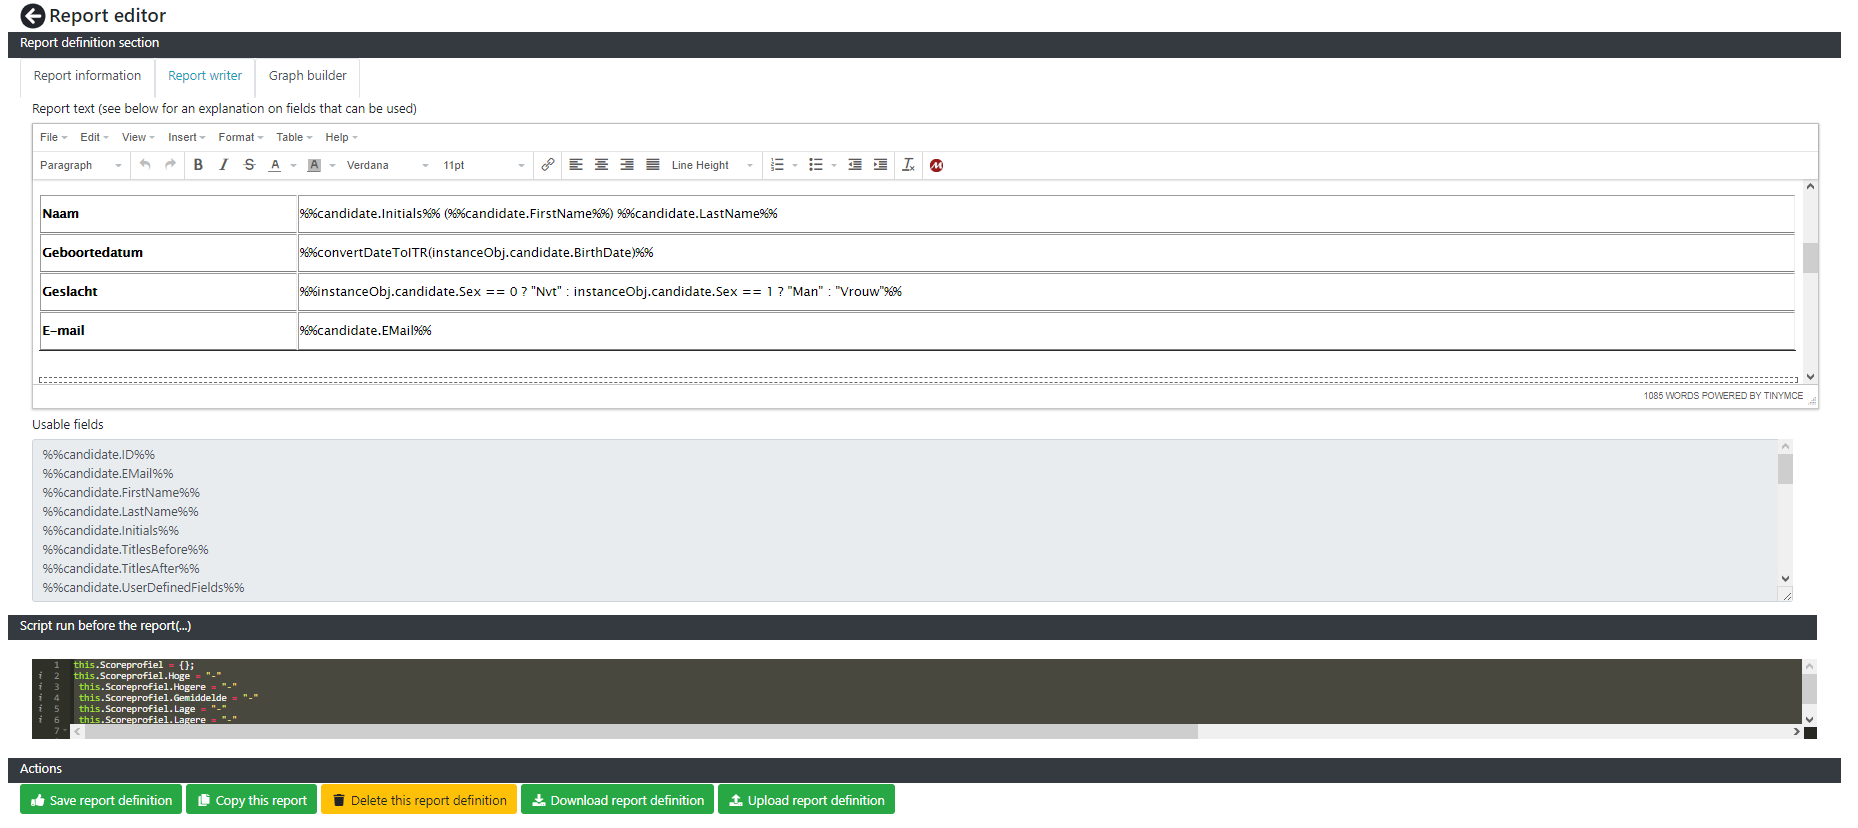
The "Report writer" tab allows you to enter the report text. On this tab you can also edit a script (that has to comply with Javascript syntax) to perform activities before the report is run. These activities are in general things like calculations, generating dynamic HTML, norming raw scores with your own norm tables et cetera.
The fields you can edit are the following.
- Report text; In this box you can enter the text of the report. It works a lot like a word processor, so you should be able to generate a first report text quickly. If you would like to use a field from the system then surround the field with %% signs. An example is %%session.Description%% which will be replaced by the description of the session when the report is generated. See Tips & tricks for more information on fields that you can use.
- In the "Usable fields" box you can view a list of fields and functions that you can use.
- Script run before the report; type a Javascript that you can run before the report. In this script you can reference the this variable to access the current context the script is executing in. You can also access functions and variables outside of this context, but that requires deep knowledge of the ITR and would make your report depend on this specific ITR version. This is not recommended. See Tips & tricks for some script examples.
If you make a calculation and assing the result to the this variable you can use this in your report by reference it as the instanceObj variable. For example if you put the following in the script box :
this.myField = "Hello world!";
then you can get and display this value in your report with :
%%instanceObj.myField%%
"Graph builder" tab
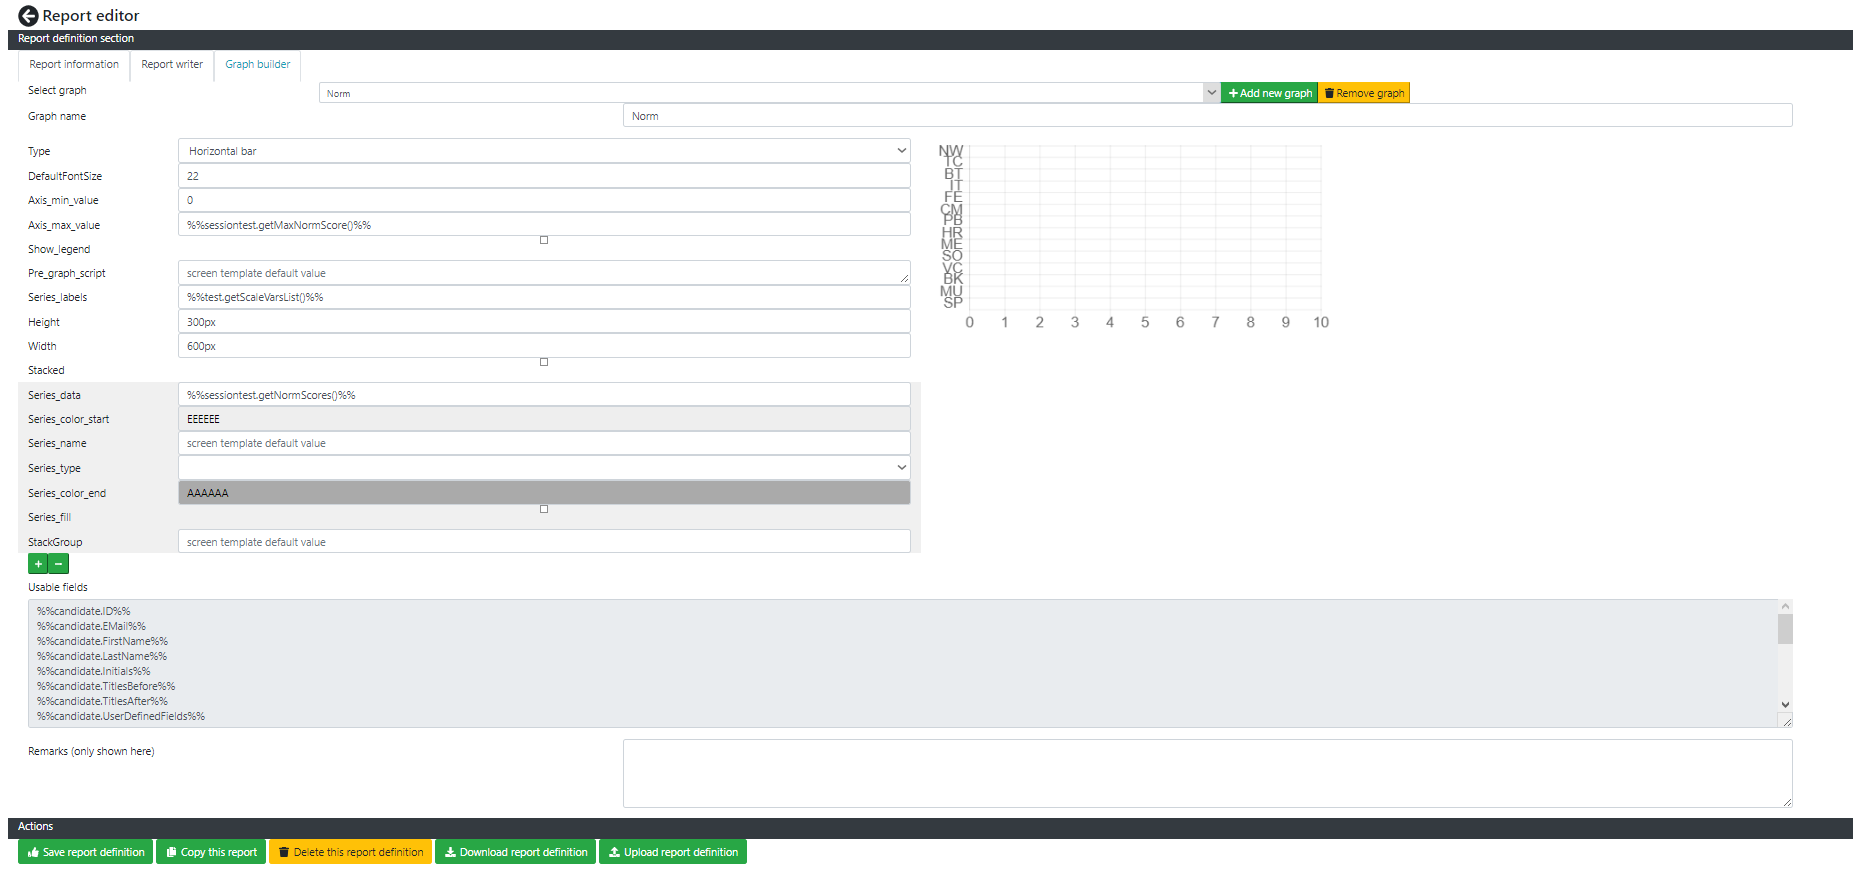
On the graph builder tab you can define graphs. There is a limited preview available.
If you want to use a graph in your report use the special field %%graph.<<Name of the graph>>%%, for example %%graph.ScoresOverview%%
If there are no graphs yet then press the button "Add new graph" to start with your first graph.
The following fields can be set.
- Type; the type of the graph.
- DefaultFontSize; the font size used for text in the graph
- Axis_min_value; the minimum value that can be shown in the graph
- Axis_max_value; the maximum value that can be shown in the graph. Use %%sessiontest.getMaxNormScore()%% to get the maximum norm score used from the test definition
- Show legend; shows a legend of presented data series in the graph
- Pre_graph_script; a Javascript executed before the graph is shown
- Series_labels; the labels of the series shown in the graph. Use %%test.getScaleVarsList()%% to get the names of the scales from the test definition
- Height & Width; height and width of the graph. You can use pixels (for example 500px) or a percentage (for example 50%)
- Stacked; if you would like to stack values of different series in the graph then check this.
For a series of data shown in the graph use the small + and - buttons below the series to add a new series or delete the last added series. For a data series you can enter the following fields.
- Series_data; the data shown for this series. Mostly you would want to use a special field like %%sessiontest.getNormScores()%% or %%sessiontest.getNormPercentileScores()%% or %%sessiontest.getScaleScores()%%. But you can also enter a list of comma separated values.
- Series_color_start; the start color of the series. Make Series_color_end the same color if you want one color for you data series. If you make Series_color_end a different color then the system will generate a color for all datapoints between the start and end color.
- Series_name; the name of the series which can be shown in the legend
- Series_type; in Bar type graphs you can change a individual series type to line if required. This will display a line in the graph. Make sure you get the order of your series right, since they are painted in the order you enter them
- Series_color_end; the end color of the series
- Series_fill; check if you want to fill the area below the line
- StackGroup; in case of stacked graphs this is the name of the stack group
Buttons
The buttons on this screen have the following functions.
- Save report definition; saves this report to the server
- Copy this report; copies the report to a new report. Immediately change the name of the report after copying to avoid confusion.
- Delete this report definition; deletes this report from the database. The report can no longer be used. Deleting is irreversible! Use with care.
- Download report definition; download this report definition to your local computer as a .itrreporttemplate file. The definition can be uploaded to other ITR installations provided they have the same test that this report is based on off course.
- Upload report definition; upload the report definition. To upload a report definition as a new report first create a new report and then upload the report definition into this new report. If you upload the report definition in an existing report the report definition will be replaced.


